DelphiでTChartを使ったグラフ描画|TeeChart・AddXY・Series活用例付き
このページでは、DelphiのVCLアプリケーションでTeeChartを使ってグラフを描画する方法を紹介します。
TChartコンポーネントとTLineSeriesを使った折れ線グラフの作成を中心に、addXYによるデータ追加、軸ラベルの設定、凡例の表示切り替えなど、実務でよく使う機能を実例コード付きで解説しています。
TeeChartの基本から応用までを一通り学べる構成になっています。
1.Delphiを起動
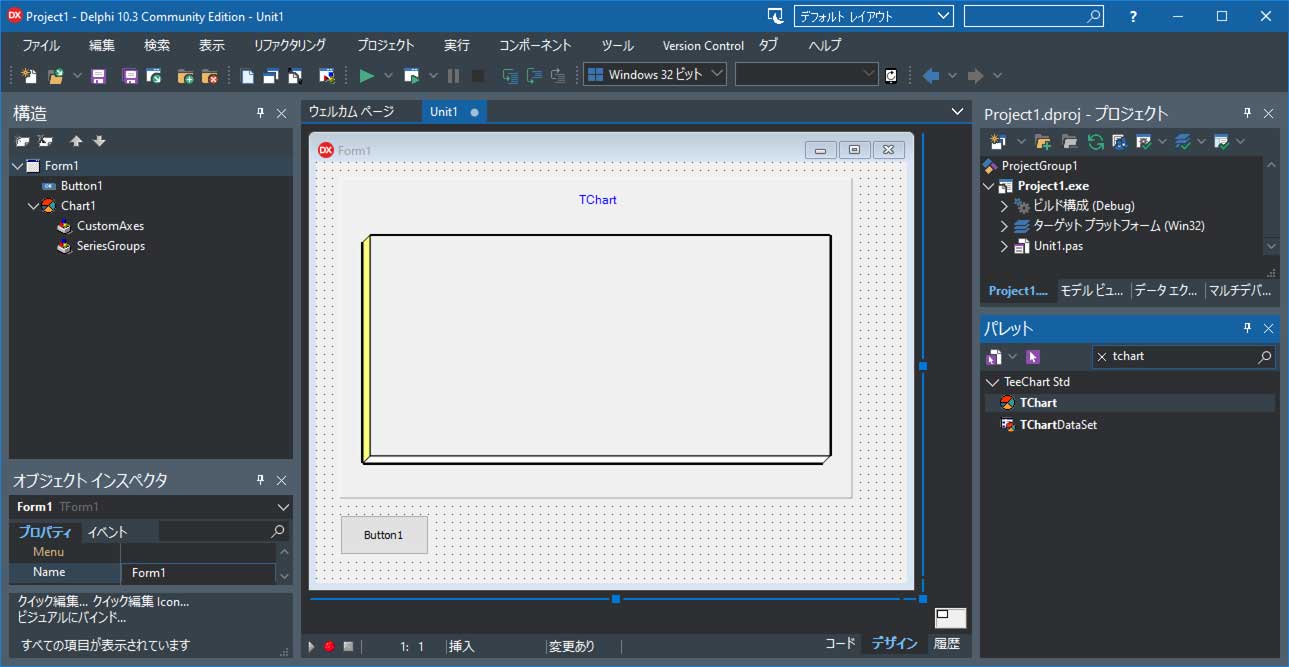
Delphiを起動して「ファイル」⇒「新規作成」⇒「Windows VCL アプリケーション -Delphi」をクリックしてVCLプロジェクトを作成します。
フォームにTButtonを1つ、TChartを1つ配置します。
プロジェクトとユニットを保存します。
ドロップしたChart1をダブルクリックするとダイアログが表示されるので、左ペインの「Series」をクリックし、右にある「Add」ボタンをクリックます。
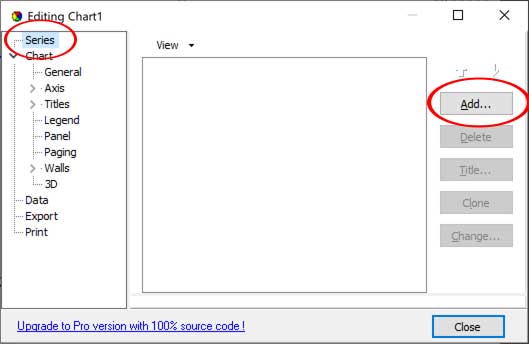
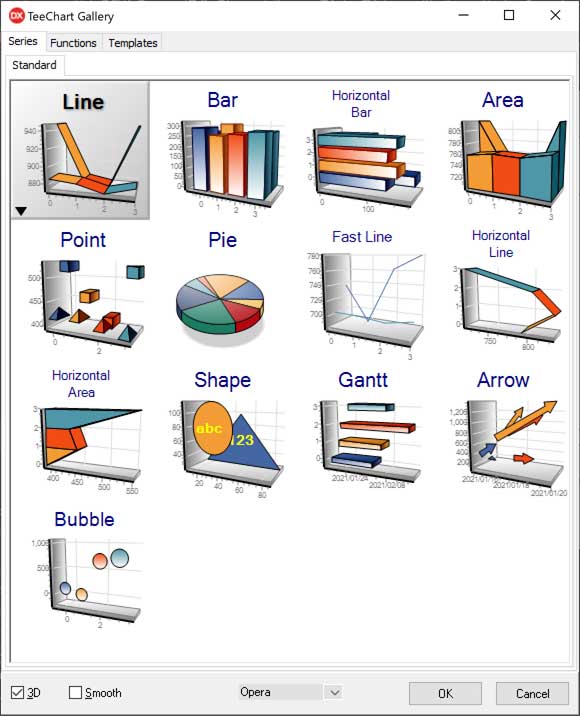
以下の13種類のグラフ系列が追加可能として表示されます。今回はプログラミングで系列も追加しますので「キャンセル」ボタンをクリックします。
TLineSeries(折れ線) TBarSeries(棒グラフ) THorizBarSeries(横方向棒グラフ) TAreaSeries TPointSeries PieSeries
TFastLineSeries THorizLineSeries THorizAreaSeries TChartShape TGanttSeries TArrowSeries TBubbleSeries
2.ソースコードの記述
折れ線グラフ2つを2Dで描画
Button1ダブルクリックしてソースを記述します。
unit Unit1;

interface

uses
  Winapi.Windows, Winapi.Messages, System.SysUtils,
  System.Variants, System.Classes, Vcl.Graphics,
  Vcl.Controls, Vcl.Forms, Vcl.Dialogs, Vcl.StdCtrls,
  Vcl.ExtCtrls,

  //TeeChartを使用する場合に必要なユニット
  VclTee.TeeGDIPlus, VCLTee.TeEngine,
  VCLTee.TeeProcs, VCLTee.Chart,
  VCLTee.Series,

  VCLTee.TeeShape, //TChartShapeを使う時に必要なユニット
  VCLTee.GanttCh,  //TGanttSeriesを使う時に必要なユニット
  VCLTee.ArrowCha, //TArrowSeriesを使う時に必要なユニット
  VCLTee.BubbleCh; //TBubbleSeriesを使う時に必要なユニット

  VCLTee.TeeEdiGene, //印刷プレビュー ダイアログ表示に必要なユニット
  VCLTee.EditChar;   //編集ダイアログ表示に必要なユニット

type
  TForm1 = class(TForm)
    Chart1: TChart;
    Button1: TButton;
    Series1: TLineSeries;
    procedure Button1Click(Sender: TObject);
  private
    { Private 宣言 }
  public
    { Public 宣言 }
  end;

var
  Form1: TForm1;

implementation

{$R *.dfm}

procedure TForm1.Button1Click(Sender: TObject);
var
  lineSeries1:TLineSeries;//折れ線グラフ系列1
  lineSeries2:TLineSeries;//折れ線グラフ系列2
begin
  //既存グラフ系列の削除
  while Chart1.SeriesCount>0 do
    Chart1.RemoveSeries(0);

  //2D表示になる
    Chart1.View3D:=False;
  //3D表示になる(デフォルト)
    //Chart1.View3D:=True;

  //タイトルの設定
  Chart1.Title.Visible:=true;
  Chart1.Title.Font.Size:=10;
  Chart1.Title.Font.Color:=RGB(0,0,0);
  Chart1.Title.Text.Text:='折れ線'#13#10'グラフ';

  //折れ線グラフ系列1の作成
  lineSeries1:=TLineSeries.Create(Chart1);
  //折れ線グラフ系列1の追加
  Chart1.AddSeries(lineSeries1);
  //折れ線グラフ系列1のタイトル
  Chart1.Series[0].Title:='折れ線1';
  //折れ線グラフ系列1の線の太さ
  Chart1.Series[0].Pen.Width:=8;
  //折れ線グラフ系列1の色(設定しない場合は自動)
  Chart1.Series[0].Color:=RGB(0,255,255);

  //折れ線グラフ系列1のポイントの追加(Y座標[,ラベル[,ラベルと線の色]])
  Chart1.Series[0].Add(24,'ラベル11');//x座標は自動で0になる
  Chart1.Series[0].Add(30,'ラベル12',RGB(255,0,0));//x座標は自動で1になる、ここの折れ線のみ赤色
  Chart1.Series[0].Add(60);//x座標は自動で2になる、ラベル省略
  Chart1.Series[0].Add(50);//x座標は自動で3になる、ラベル省略


  //折れ線グラフ系列2の作成
  lineSeries2:=TLineSeries.Create(Chart1);
  //折れ線グラフ系列2の追加
  Chart1.AddSeries(lineSeries2);
  //折れ線グラフ系列2のタイトル
  Chart1.Series[1].Title:='折れ線2';
  //折れ線グラフ系列2の線の太さ
  Chart1.Series[1].Pen.Width:=8;
  //折れ線グラフ系列2の色(設定しない場合は自動)
  Chart1.Series[1].Color:=RGB(255,0,255);

  //折れ線グラフ系列2のポイントの追加(X座標,Y座標[,ラベル[,ラベルと線の色]])
  Chart1.Series[1].Add(30,'ラベル21');//x座標は自動で0になる
  Chart1.Series[1].Add(40,'ラベル22');//x座標は自動で1になる
  Chart1.Series[1].Add(50,'ラベル23');//x座標は自動で2になる、ラベル省略
end;
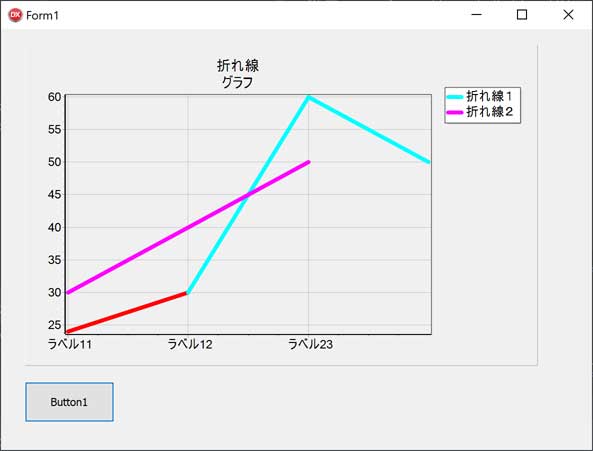
実行して、Button1をクリックすると以下のようにグラフが表示されます。
折れ線グラフ2つをX軸とY軸を指定して3D描画
Button1ダブルクリックしてソースを記述します。
procedure TForm1.Button1Click(Sender: TObject);
var
  lineSeries1:TLineSeries;//折れ線グラフ系列1
  lineSeries2:TLineSeries;//折れ線グラフ系列2
begin
  //既存グラフ系列の削除
  while Chart1.SeriesCount>0 do
    Chart1.RemoveSeries(0);

  //2D表示になる
    //Chart1.View3D:=False;
  //3D表示になる(デフォルト)
    Chart1.View3D:=True;

  //3Dの時の奥行方向の割合 0-100
    Chart1.Chart3DPercent:=50;

  //タイトルの設定
    Chart1.Title.Visible:=True;
    Chart1.Title.Font.Size:=10;
    Chart1.Title.Font.Color:=RGB(0,0,0);
    Chart1.Title.Text.Text:='折れ線'#13#10'グラフ2';

  //Chart1.LeftAxis   左軸   Chart1.RightAxis 右軸
  //Chart1.BottomAxis 下軸   Chart1.TopAxis   上軸
  //下軸を表示
    Chart1.BottomAxis.Visible:=True;
  //下軸の最小値と最大値の設定
    //Chart1.BottomAxis.AutomaticMaximum:=False;
    //Chart1.BottomAxis.AutomaticMinimum:=False;
    Chart1.BottomAxis.SetMinMax(-10,80);

  //下軸の最小値と最大値を自動にする
    //Chart1.BottomAxis.AutomaticMaximum:=True;
    //Chart1.BottomAxis.AutomaticMinimum:=True;

  //下軸ラベルは無し
    //Chart1.BottomAxis.LabelStyle:=TAxisLabelStyle.talNone;
  //下軸ラベルは自動(実際にはラベルの文字が表示される)
    //Chart1.BottomAxis.LabelStyle:=TAxisLabelStyle.talAuto;
  //下軸のラベルは均等に値を配置する
    Chart1.BottomAxis.LabelStyle:=TAxisLabelStyle.talValue;
  //下軸ラベルはグラフに追加するラベルの文字+ラベル無しの場合はYの値
    //Chart1.BottomAxis.LabelStyle:=TAxisLabelStyle.talMark;
  //下軸ラベルはグラフに追加するポイントのX座標の値
    //Chart1.BottomAxis.LabelStyle:=TAxisLabelStyle.talPointValue;
  //下軸ラベルはグラフに追加するラベルの文字
    //Chart1.BottomAxis.LabelStyle:=TAxisLabelStyle.talText;

  //下軸ラベルは1段に表示する
    Chart1.BottomAxis.LabelsAlternate:=False;
  //下軸ラベルは上下2段に分散して表示する
    //Chart1.BottomAxis.LabelsAlternate:=true;

  //下軸ラベルスタイルがラベルの文字列の場合のにフォーマットをHTMLにする
    //Chart1.BottomAxis.LabelsFormat.TextFormat:=TTextFormat.ttfHtml;
  //下軸ラベルスタイルがtalValueの場合のフォーマットを設定(3桁カンマ、小数点2桁)する
    Chart1.BottomAxis.AxisValuesFormat:='#,##0.00';

  //下軸の主目盛の間隔を設定
    //Chart1.BottomAxis.Increment:=0;//automatic
    Chart1.BottomAxis.Increment:=8;

  //下軸の副目盛を表示しない
    //Chart1.BottomAxis.MinorTicks.Visible:=False;

  //左軸の最小値と最大値の設定
    //Chart1.LeftAxis.SetMinMax(0,60);

  //左軸のタイトルを設定
    Chart1.LeftAxis.Title.Visible:=True;
    Chart1.LeftAxis.Title.Text:='(円)';

  //凡例を非表示
    //Chart1.Legend.Visible:=False;
  //凡例の位置を下にする
    Chart1.Legend.Alignment:=TLegendAlignment.laBottom;
  //凡例を折れ線のタイトルにする
    Chart1.Legend.LegendStyle:=TLegendStyle.lsSeries;
  //凡例を折れ線の値にする
    //Chart1.Legend.LegendStyle:=TLegendStyle.lsValues;

  //折れ線グラフ系列1の作成
    lineSeries1:=TLineSeries.Create(Chart1);
  //折れ線グラフ系列1の追加
    Chart1.AddSeries(lineSeries1);
  //折れ線グラフ系列1のタイトル
    Chart1.Series[0].Title:='折れ線1';
  //折れ線グラフ系列1の線の太さ
    //Chart1.Series[0].Pen.Width:=8;
  //折れ線グラフ系列1の色(設定しない場合は自動)
    Chart1.Series[0].Color:=RGB(255,0,0);

  //折れ線グラフ1のポイントの追加(X座標,Y座標[,ラベル[,ラベルと線の色]])
    Chart1.Series[0].AddXY(12,35,'ラベル11');
    Chart1.Series[0].AddXY(25,22);
    Chart1.Series[0].AddXY(46,30);
    Chart1.Series[0].AddXY(60,42,'ラベル14');

  //折れ線グラフ系列2の作成
    lineSeries2:=TLineSeries.Create(Chart1);
  //折れ線グラフ系列2の追加
    Chart1.AddSeries(lineSeries2);
  //折れ線グラフ系列2のタイトル
    Chart1.Series[1].Title:='折れ線2';
  //折れ線グラフ系列2の線の太さ
    //Chart1.Series[1].Pen.Width:=8;
  //折れ線グラフ系列2の色(設定しない場合は自動)
    Chart1.Series[1].Color:=RGB(255,0,255);

  //折れ線グラフ2のポイントの追加(X座標,Y座標[,ラベル[,ラベルと線の色]])
    Chart1.Series[1].AddXY(0,35,'ラベル21');
    Chart1.Series[1].AddXY(12,20,'ラベル22');
    Chart1.Series[1].AddXY(70,15)
end;
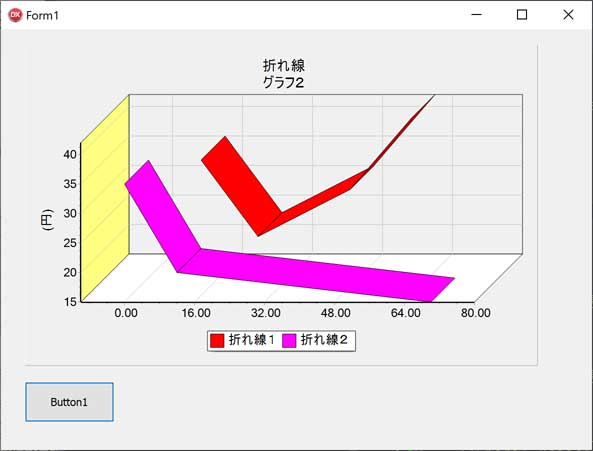
実行して、Button1をクリックすると以下のようにグラフが表示されます。
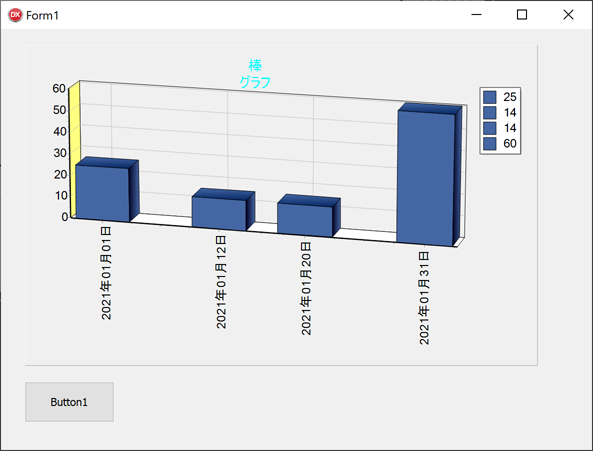
棒グラフを3D描画
Button1ダブルクリックしてソースを記述します。
procedure TForm1.Button1Click(Sender: TObject);
var BarSeries1:TBarSeries;
begin
  //既存グラフの削除
  while Chart1.SeriesCount>0 do
    Chart1.RemoveSeries(0);

  //2D表示になる
    //Chart1.View3D:=False;
  //3D表示になる(デフォルト)
    Chart1.View3D:=True;

  //直交座標をオフにする
    Chart1.View3DOptions.Orthogonal:=False;
  //回転を345度に設定
    Chart1.View3DOptions.Rotation:=345;
  //仰角を345度に設定
    Chart1.View3DOptions.Elevation:=345;
  //奥行きを40%に設定する(0に設定すると実質2Dになる)
    Chart1.Chart3DPercent:=40;

  //タイトルの設定
    Chart1.Title.Visible:=true;
    Chart1.Title.Font.Size:=10;
    Chart1.Title.Font.Color:=rgb(0,255,255);
    Chart1.Title.Text.Text:='棒'#13#10'グラフ';

  //下軸のフォーマットを設定する
    Chart1.BottomAxis.DateTimeFormat:='yyyy年mm月dd日';

  //下軸の最小値と最大値を自動にする
    //Chart1.BottomAxis.AutomaticMaximum:=True;
    //Chart1.BottomAxis.AutomaticMinimum:=True;
  //下軸の最大値と最大値を設定する
    Chart1.BottomAxis.SetMinMax(EncodeDate(2020,12,29),encodedate(2021,2,3));
  //以下でも同じ
    //Chart1.BottomAxis.Minimum:=EncodeDate(2020,12,30);
    //Chart1.BottomAxis.Maximum:=EncodeDate(2021,2,2);

  //下軸のラベルを90度回転表示(縦向きになる)
    Chart1.BottomAxis.LabelsAngle:=90;

  //下軸の主目盛の間隔を7日に設定
    Chart1.BottomAxis.Increment:=7;

  //下軸のラベルを以下で追加するポイントのX座標の値(日付)に設定
    Chart1.BottomAxis.LabelStyle:=TAxisLabelStyle.talPointValue;

  //ラベルに改行#13#10が有ればその位置で改行する
    //Chart1.BottomAxis.LabelsMultiLine:=true;

  //棒グラフ1の作成
    BarSeries1:=TBarSeries.Create(Chart1);
  //棒グラフの追加
    Chart1.AddSeries(BarSeries1);
  //棒グラフ1のタイトル
    Chart1.Series[0].Title:='棒1';
  //棒グラフ1のXの値を日時に設定する
    Chart1.Series[0].XValues.DateTime:=True;

  //ポイントを追加
    Chart1.Series[0].AddXY(Encodedate(2021,1,1),25);
    Chart1.Series[0].AddXY(Encodedate(2021,1,12),14);
    Chart1.Series[0].AddXY(Encodedate(2021,1,31),60);
    Chart1.Series[0].AddXY(Encodedate(2021,1,20),14);

  //ポイントに表示されるマークを非表示にする
    Chart1.Series[0].Marks.Visible:=False;

  //bmp画像ファイルとして保存する場合
  Chart1.SaveToBitmapFile('graph.bmp');

  //jpgファイルとして保存する場合
  //  uses に jpegが必要
  //  var に bmp:TBitmap;jpg:TJpegImage;が必要
  //bmp:=TBitmap.Create;
  //bmp.SetSize(Chart1.Width,Chart1.Height);
  //Chart1.Draw(bmp.Canvas,Rect(0,0,bmp.Width,bmp.Height));
  //jpg:=TJpegImage.Create;
  //jpg.Assign(bmp);
  //jpg.CompressionQuality:=50;//JPG圧縮率設定
  //jpg.Compress;              //JPG圧縮
  //jpg.SaveToFile('graph.jpg');//.jpgファイルに保存
  //bmp.Free;
  //jpg.Free;

end;
実行して、Button1をクリックすると以下のようにグラフが表示されます。
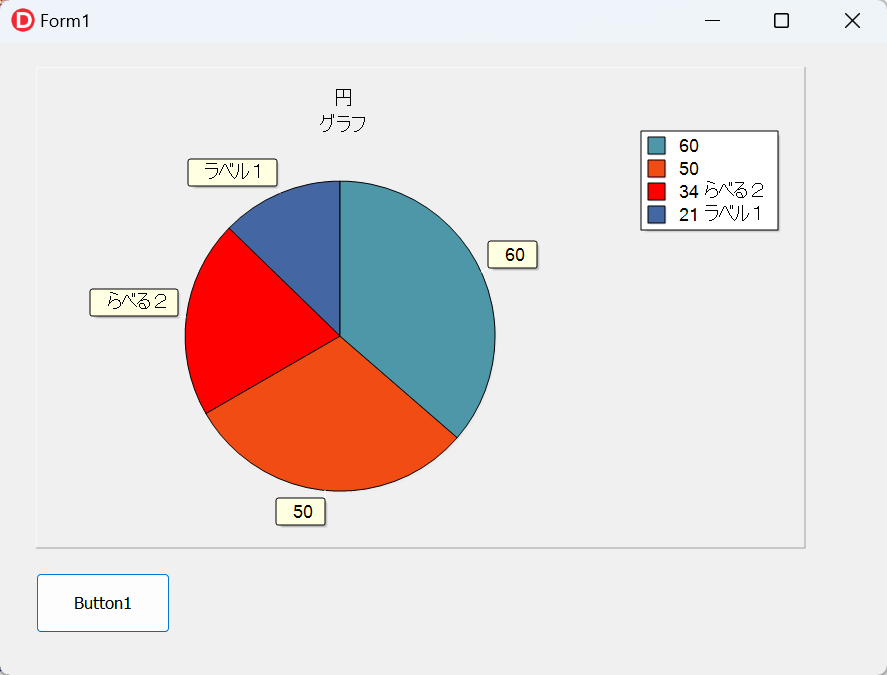
円グラフを2Dで描画
円グラフを描画して、ビットマップファイルとして保存し、
チャート画像をTBitmapにコピーし、
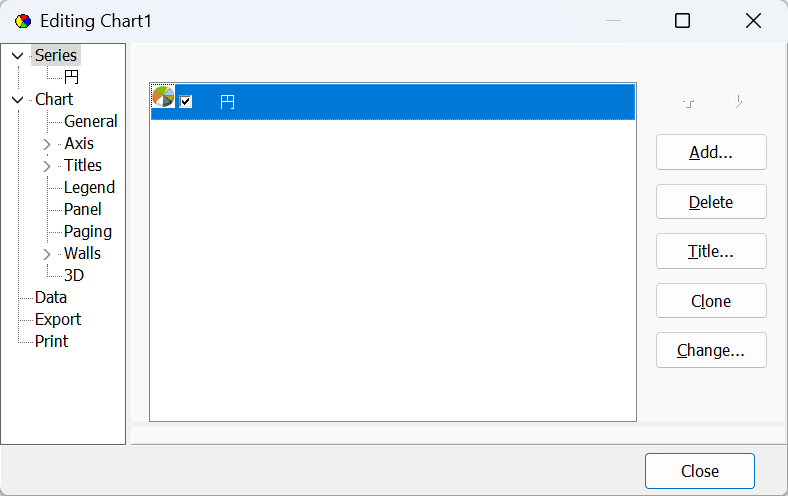
編集ダイアログを表示して、
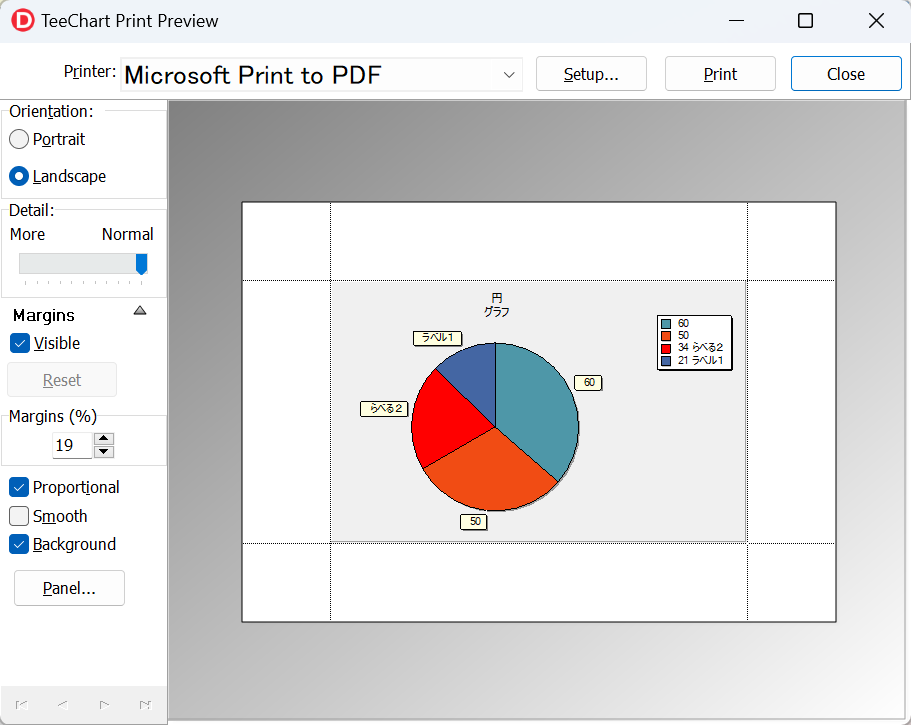
印刷プレビューダイアログを表示させます。
Button1ダブルクリックしてソースを記述します。
procedure TForm1.Button1Click(Sender: TObject);
var pieSeries:TPieSeries;
    bmp:TBitmap;
begin
  //既存グラフ系列の削除
  while Chart1.SeriesCount>0 do
    Chart1.RemoveSeries(0);

  //2D表示になる
    Chart1.View3D:=False;
  //3D表示になる(デフォルト)
    //Chart1.View3D:=True;

  //タイトルの設定
  Chart1.Title.Visible:=true;
  Chart1.Title.Font.Size:=10;
  Chart1.Title.Font.Color:=RGB(0,0,0);
  Chart1.Title.Text.Text:='円'#13#10'グラフ';

  //円グラフの作成
  pieSeries:=TPieSeries.Create(Chart1);
  //円グラフを追加する
  Chart1.AddSeries(pieSeries);
  //円グラフのタイトル
  Chart1.Series[0].Title:='円';
  //円グラフの線の太さ
  Chart1.Series[0].Pen.Width:=1;

  //円グラフ系列1のポイントの追加(Y座標[,ラベル[,ラベルと線の色]])
  //値の小さい順に追加する
  Chart1.Series[0].Add(21,'ラベル1');//色は自動
  Chart1.Series[0].Add(34,'らべる2',RGB(255,0,0));//この扇形は赤色指定
  Chart1.Series[0].Add(50);//ラベル省略,色自動
  Chart1.Series[0].Add(60);//ラベル省略,色自動

  //水平方向右が0度なので反時計回りに90度回転させる
  TPieSeries(Chart1.Series[0]).RotationAngle:=90;

  //TChartListOrder,loNone       ソートしない
  //TChartListOrder.loAscending  昇順に反時計回り
  //TChartListOrder.loDescending 降順に反時計回り
  //ラベルを使用して反時計回りに昇順にソートする(ラベルでのソートになる)
  //Chart1.Series[0].SortByLabels(TChartListOrder.loAscending);

  //凡例を表示
    Chart1.Legend.Visible:=True;
  //凡例の位置を右にする
    Chart1.Legend.Alignment:=TLegendAlignment.laRight;

  //凡例を自動にする
    Chart1.Legend.LegendStyle:=TLegendStyle.lsAuto;

  //凡例の表示順を逆にする
  Chart1.Legend.Inverted:=True;

  //ビットマップファイルに保存する
  Chart1.SaveToBitmapFile('pie.bmp');

  //TBitmapとして画像を取り出す
  bmp:=Chart1.TeeCreateBitmap();
  bmp.SaveToFile('pie2.bmp');
  bmp.Free;

  //チャートの編集ダイアログを表示する
  VCLTee.EditChar.EditChart(Self,Chart1);

  //チャートの印刷プレビューダイアログを表示する
  VCLTee.TeeEdiGene.ChartPreview(self,Chart1);
end;

end.
実行して、Button1をクリックすると以下のように円グラフが表示され、チャート編集ダイアログが表示され、印刷プレビューダイアログが表示されます。